Data Visualization Gallery
Biomechanics
Interactive Ground Reaction Force Plot
Plot Development
- Drop vertical jump GRF measured by force plates.
-
Data preprocessed with R.
- Time normalized.
- Averaged GRF waveform. - Plot created using Plotly library.
- Exported as an HTML file.
Plot Legend
- X-axis: Anterior-Posterior (Blue)
- Y-axis: Medial-Lateral (Red)
- Z-axis: Vertical (Green)
- Green Trace: Healthy Limb
- Orange Trace: ACL Reconstructed Limb
Description: 3D visualization of ground reaction forces (GRF) during a drop vertical jump after ACL reconstruction. Visualizing the GRF during the jump landing, we can visually inspect asymmetries in GRF between the healthy and reconstructed limbs. Click here for more information on the study.
Dashboard Engineering
Knee Injury Progress Report
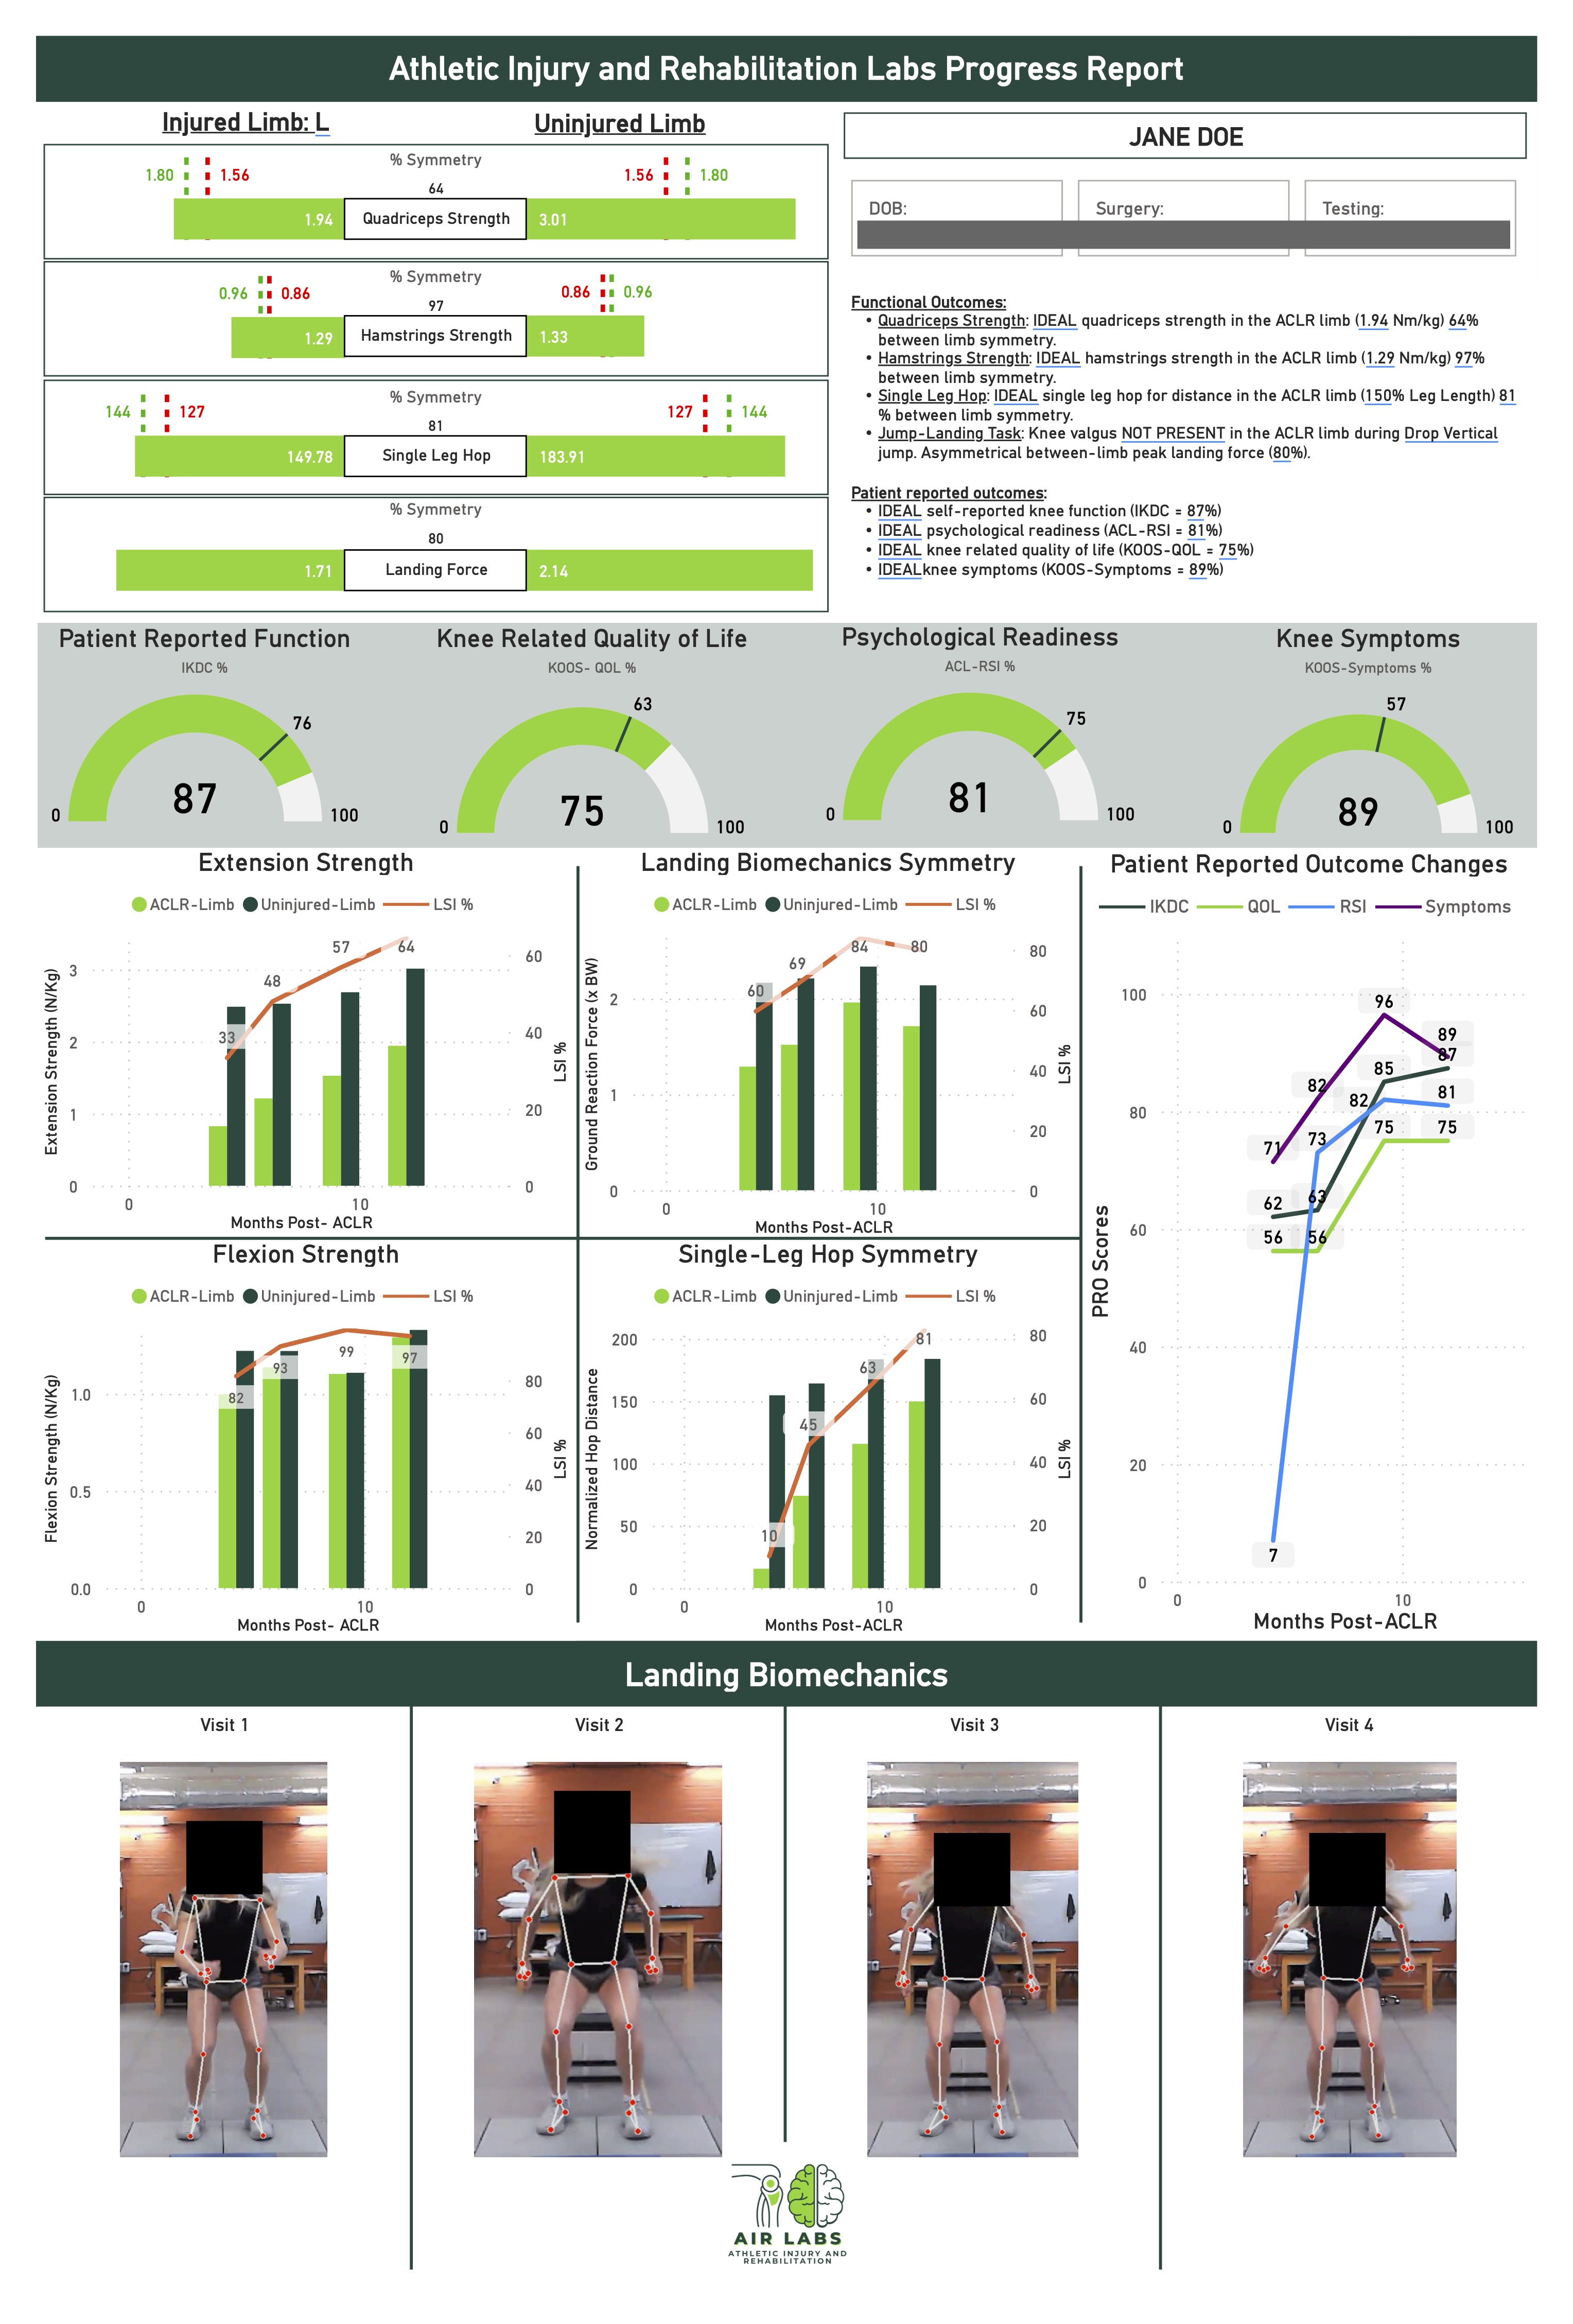
As a part of a longitudinal project assessing patient outcomes after knee injury I have developed a report to describe participant physical and mental outcomes.
- Data collected and entered into REDCap project database.
- PowerBI retrieves participant data via the API.
- Report is automatically generated with visuals and text summary.
Automated reporting has improved participant retention and buy-in from the surgical/rehabilitation team and participant.
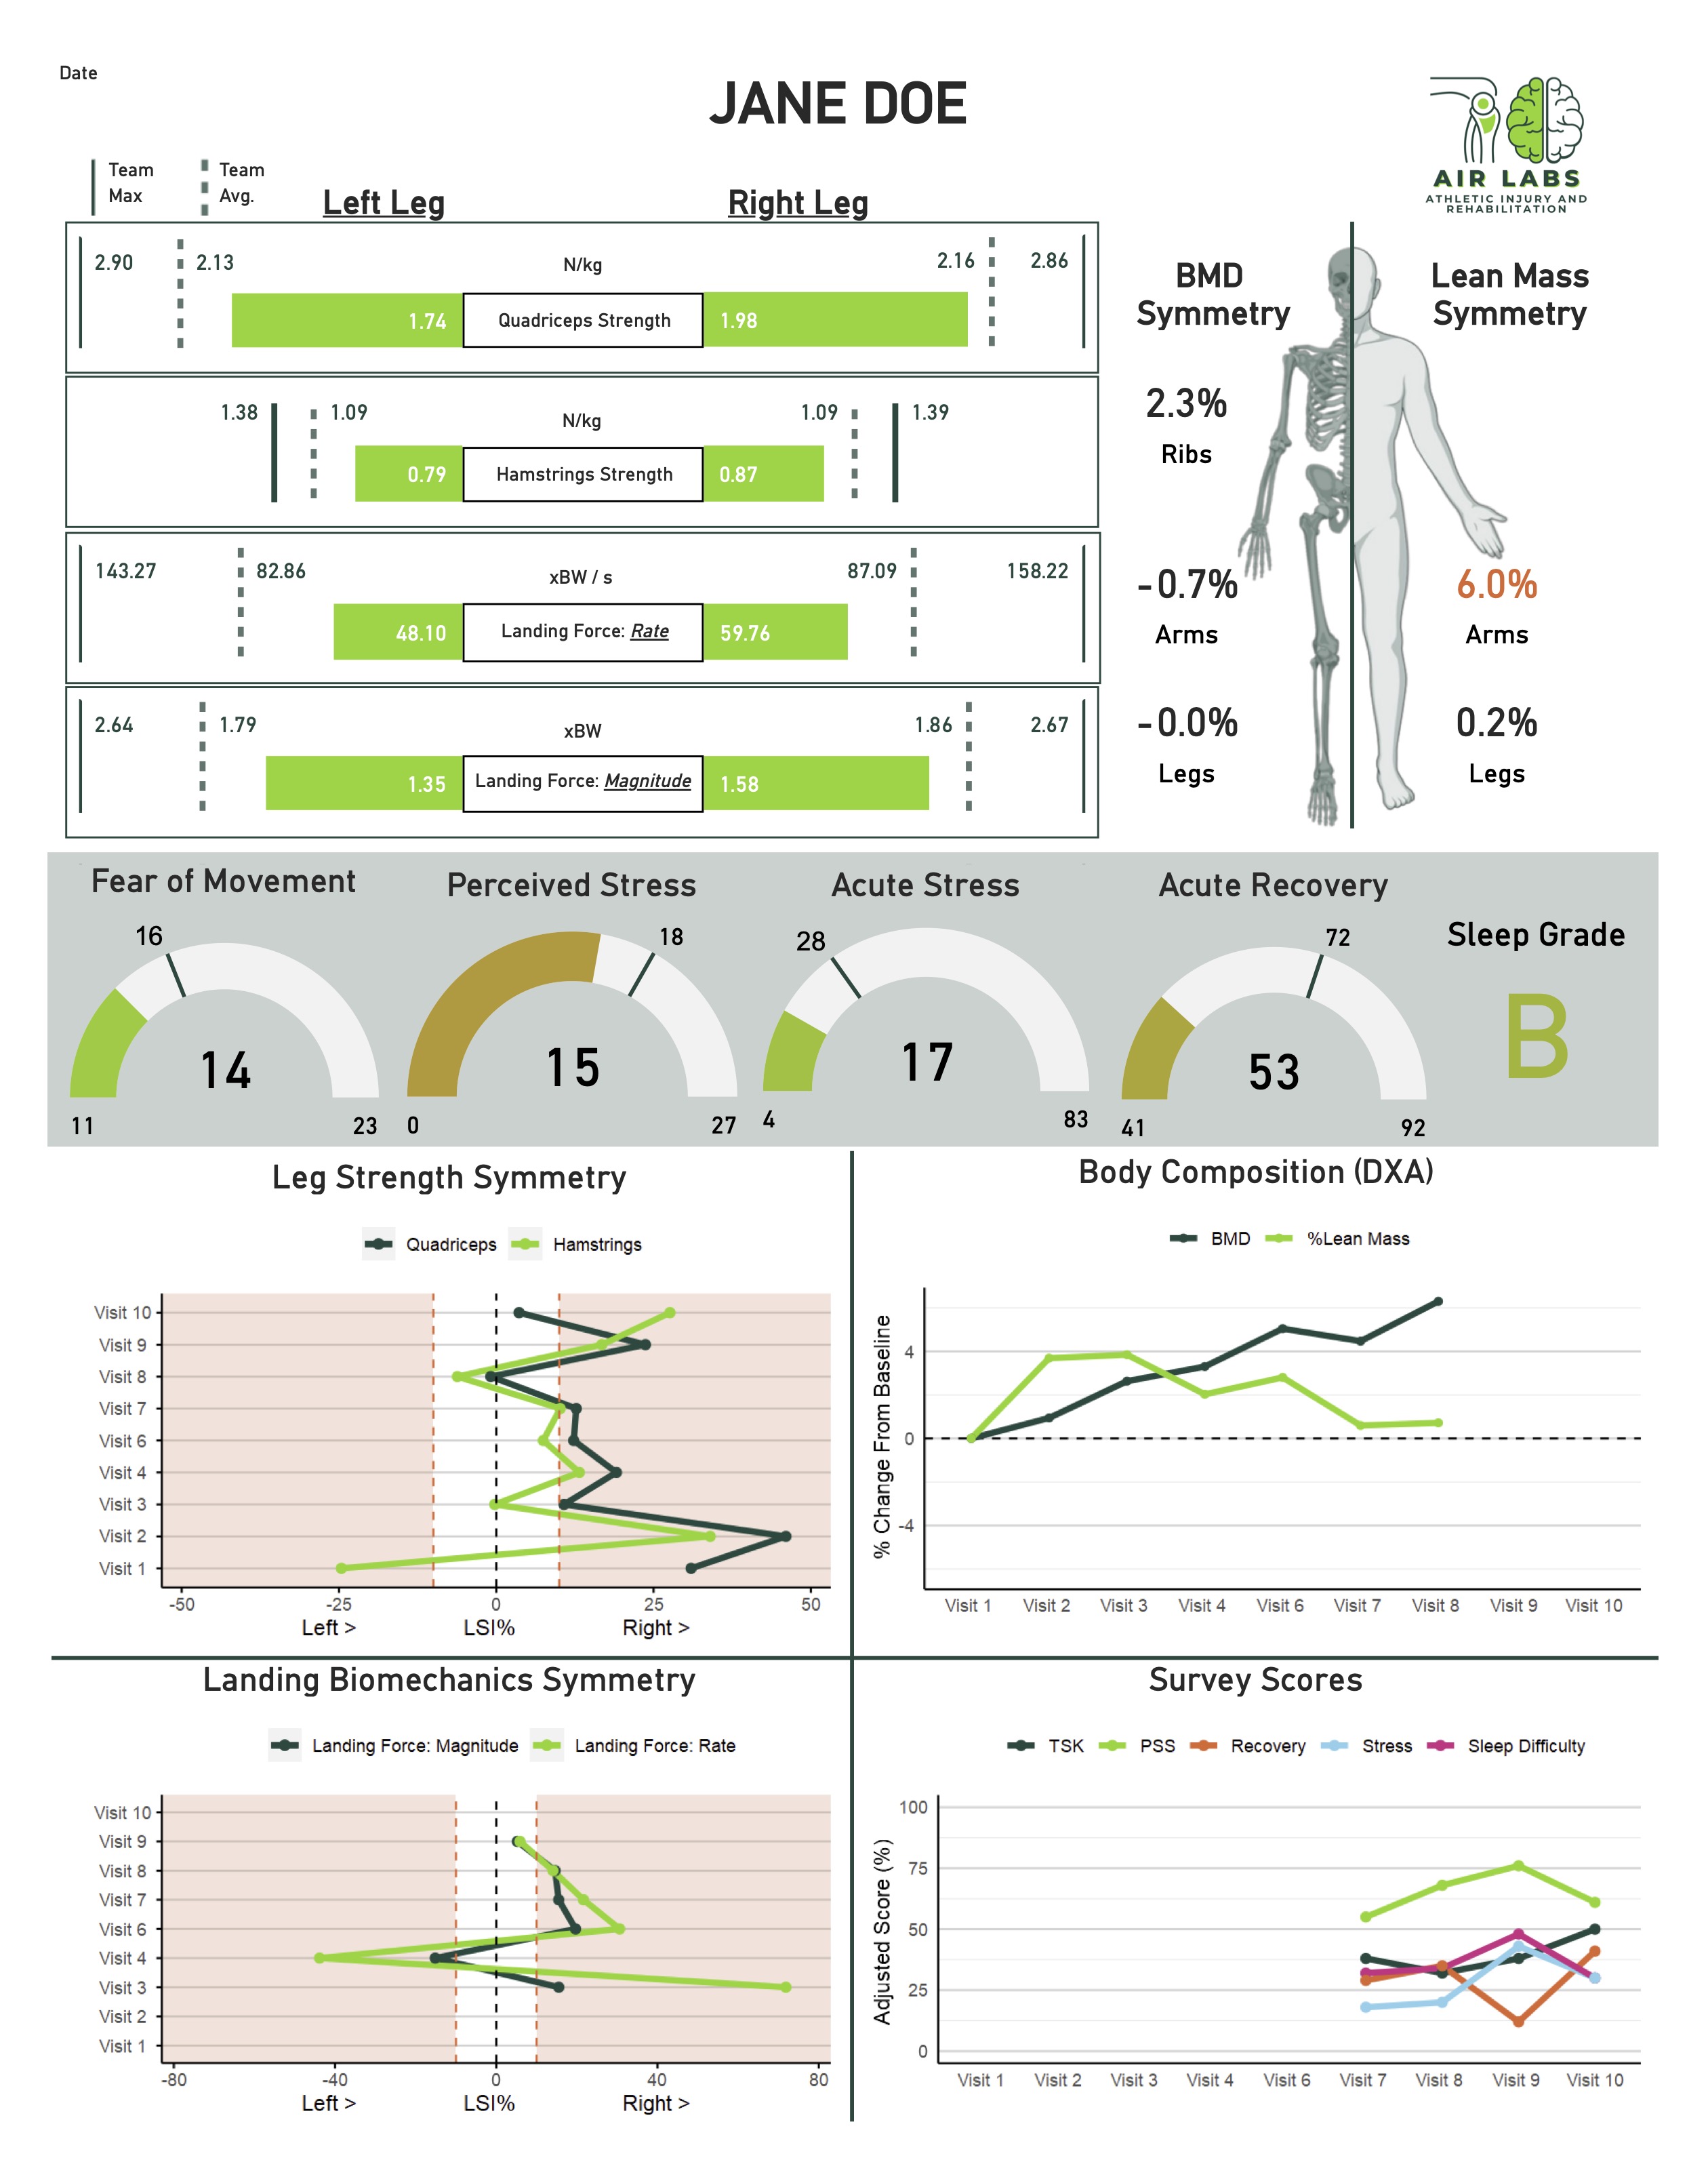
Athlete Testing Report
As a part of a longitudinal project assessing MSU female athlete injury risk, funded by Nike.
- Data collected and entered into REDCap project database.
- PowerBI retrieves participant data via the API.
- Report is automatically generated with visuals and text summary.
- Custom R and python scripts visualize data
Automated reporting has improved participant retention over three years. Reports are used by the athlete care team to reduce injury risk and improve performance.